Charting Altitude Adjustments in Scoring Forecasts Across Mountain Venues in Global Team Matchups
Parker Franke · Aug 24, 2026
Charting Altitude Adjustments in Scoring Forecasts Across Mountain Venues in Global Team Matchups
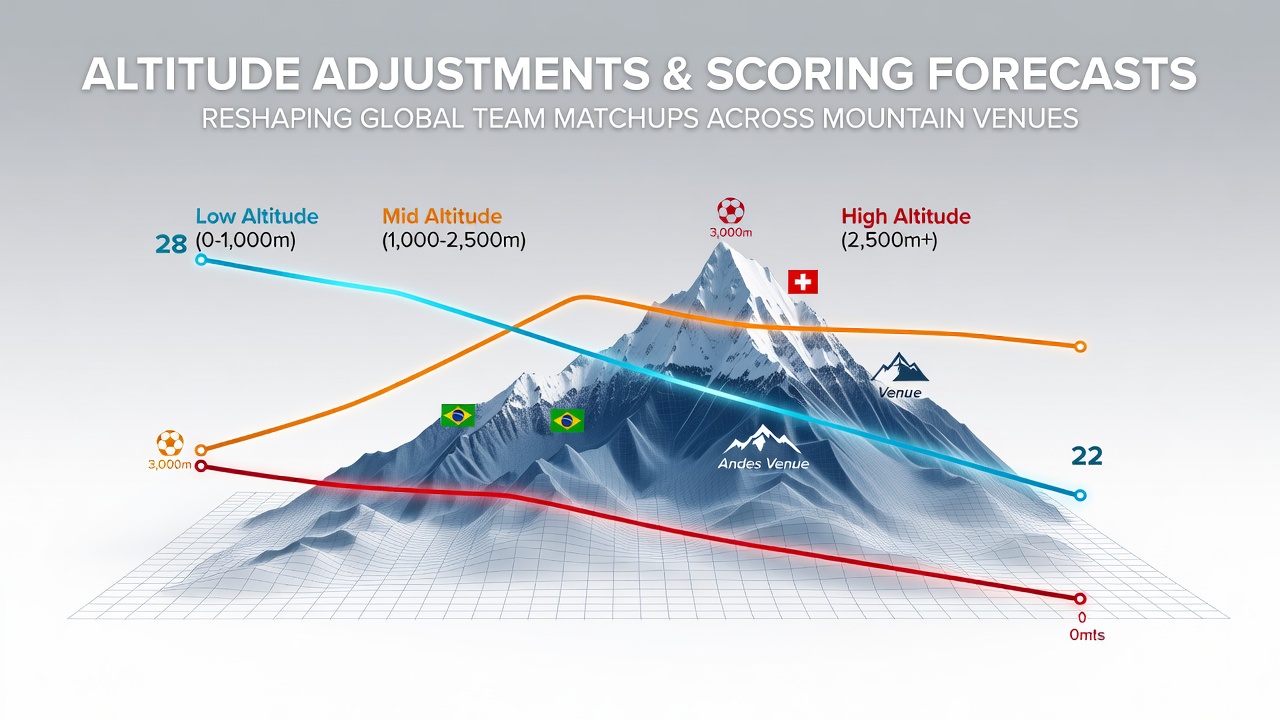
High-altitude venues in global team sports continue to require precise modifications to scoring forecasts as air density drops and physiological demands rise; researchers track these variables through layered data sets that integrate atmospheric measurements with historical match outcomes. In August 2026, analysts preparing for upcoming international fixtures across the Rockies, Andes, and other elevated regions refine their models to account for thinner air that alters both ball flight distances and athlete endurance thresholds.
Atmospheric Factors Driving Forecast Revisions
Air pressure decreases at elevations above 1,500 meters, which reduces drag on projectiles while simultaneously limiting oxygen availability for sustained efforts; meteorologists supply real-time density readings that feed into predictive algorithms used by performance analysts. These adjustments appear in expected goals calculations for soccer and run totals for baseball, where data collected at sites like Denver's Coors Field and Mexico City's Estadio Azteca show measurable increases in offensive output during daytime matches under low humidity conditions.
Studies from the University of Colorado Boulder demonstrate that baseballs travel approximately 10 percent farther at 1,610 meters compared with sea-level equivalents, prompting forecasters to recalibrate home-run probabilities and extra-base hit projections before each series. Similar patterns emerge in soccer, where long-range shots and crosses gain extended range, leading analysts to update xG models that incorporate venue-specific coefficients derived from thousands of tracked events.
Regional Case Studies and Data Integration
Teams competing in La Paz, Bolivia, at 3,650 meters face compounded challenges that extend beyond ball behavior to include accelerated fatigue; FIFA technical reports document average distance covered per player dropping by 8 to 12 percent in the second half of matches at this elevation. Forecasting groups therefore apply tiered multipliers that scale expected scoring rates downward for visiting sides while elevating projections for home teams acclimated to the conditions.
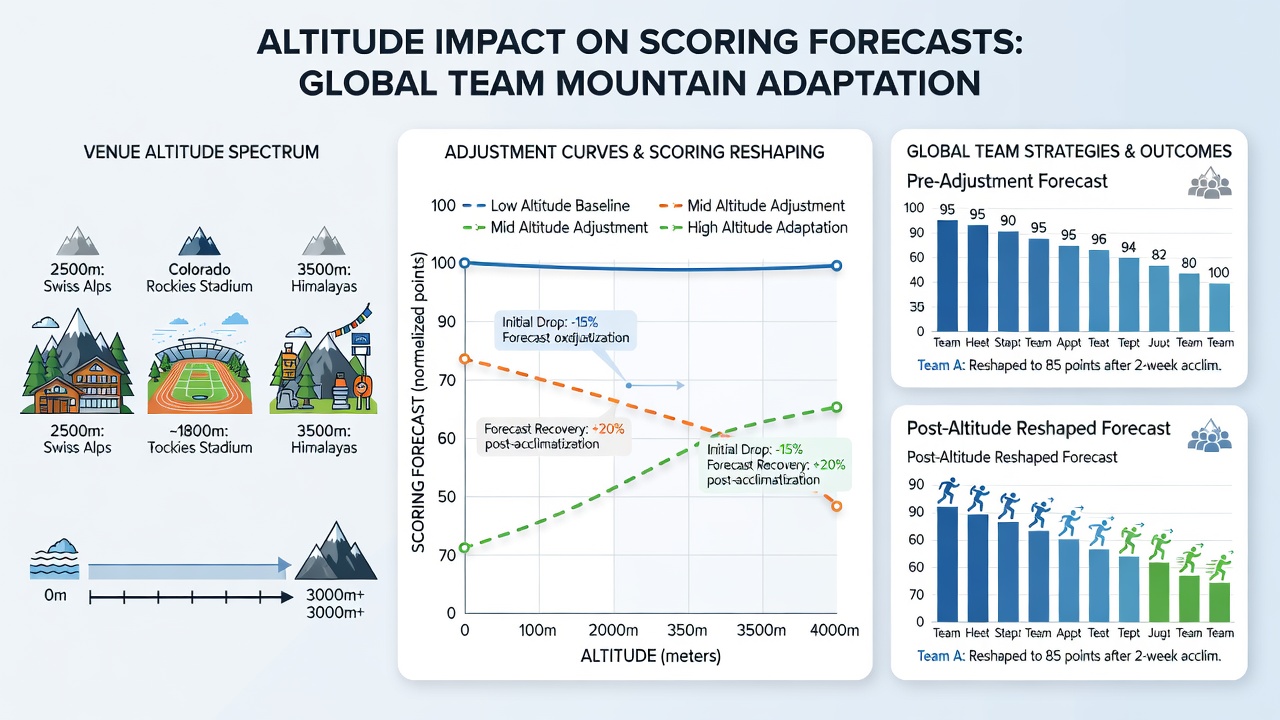
European clubs traveling to South American qualifiers encounter parallel adjustments, as seen in recent Copa Libertadores encounters where visiting midfielders exhibit reduced high-intensity running metrics tracked via GPS systems. Analysts cross-reference these figures with historical results from venues such as Quito, Ecuador, at 2,850 meters, producing venue-adjusted scoring bands that narrow prediction intervals for both total goals and halftime margins. Australian research institutions contribute comparative data from training camps conducted in the Snowy Mountains, confirming that acclimatization periods of 10 to 14 days stabilize player output closer to baseline levels.
Model Refinement Techniques Across Sports
Performance analysts employ multivariate regression frameworks that combine elevation, temperature, humidity, and time-of-day variables to generate venue-specific scoring baselines; these frameworks undergo continuous validation against live match data collected during the 2026 international calendar. In rugby sevens tournaments staged at elevated South African venues, researchers from Stellenbosch University have published coefficients that adjust try-scoring expectations upward by 15 percent for teams with prior exposure, while downward revisions apply to squads arriving within 72 hours of kickoff.
Baseball statisticians in North America integrate radar-tracked exit velocities with local atmospheric readings to refine slugging percentage forecasts at Coors Field, where the 2026 season data reveals sustained elevation effects even after multiple series. Cricket analysts examining limited-overs matches in the Himalayas apply parallel corrections to six-hitting probabilities, noting that reduced air density increases carry distances for lofted shots and necessitates updated boundary projection models.
Global Data Sharing and Standardization Efforts
International governing bodies coordinate data repositories that allow forecasters to access standardized altitude-corrected metrics from competitions spanning multiple continents; this collaboration supports consistent application of adjustment factors across different sports and league structures. Canadian research teams at the University of British Columbia contribute longitudinal studies on ice hockey performance at venues above 1,000 meters, documenting shifts in shot volume and save percentages that inform hybrid models blending winter and summer sport datasets.
These standardized approaches enable analysts to generate comparable forecasts for upcoming fixtures, including those scheduled in the latter half of 2026, where mountain venues feature prominently in qualification pathways for major tournaments. Continuous validation against emerging match data ensures that scoring projections remain aligned with observed outcomes rather than static assumptions.
Conclusion
Altitude-driven adjustments to scoring forecasts rely on integrated atmospheric, physiological, and historical performance data that analysts update regularly across global mountain venues. As the 2026 calendar progresses, these refined models support accurate projections for team matchups in soccer, baseball, rugby, and cricket by accounting for the measurable effects of reduced air density and oxygen availability on both equipment behavior and athlete output.